How To Analyze A BALANCE SHEET

Table of Contents
How To Analyze A BALANCE SHEET
What Is a Balance Sheet?
A Balance Sheet reflects a company’s financial position on a specific date showing what it owns (assets), what it owes (liabilities), and the owners’ stake (equity). Analyzing it helps assess liquidity, solvency, and overall financial health. A snapshot of a company’s financial position at a specific point in time. Shows what the company owns (assets) and owes (liabilities). Represents the company’s net worth. Balance Sheet Equation :
Assets=Liabilities+Shareholders’ Equity\{Assets} = \{Liabilities} + \{Shareholders’ Equity}
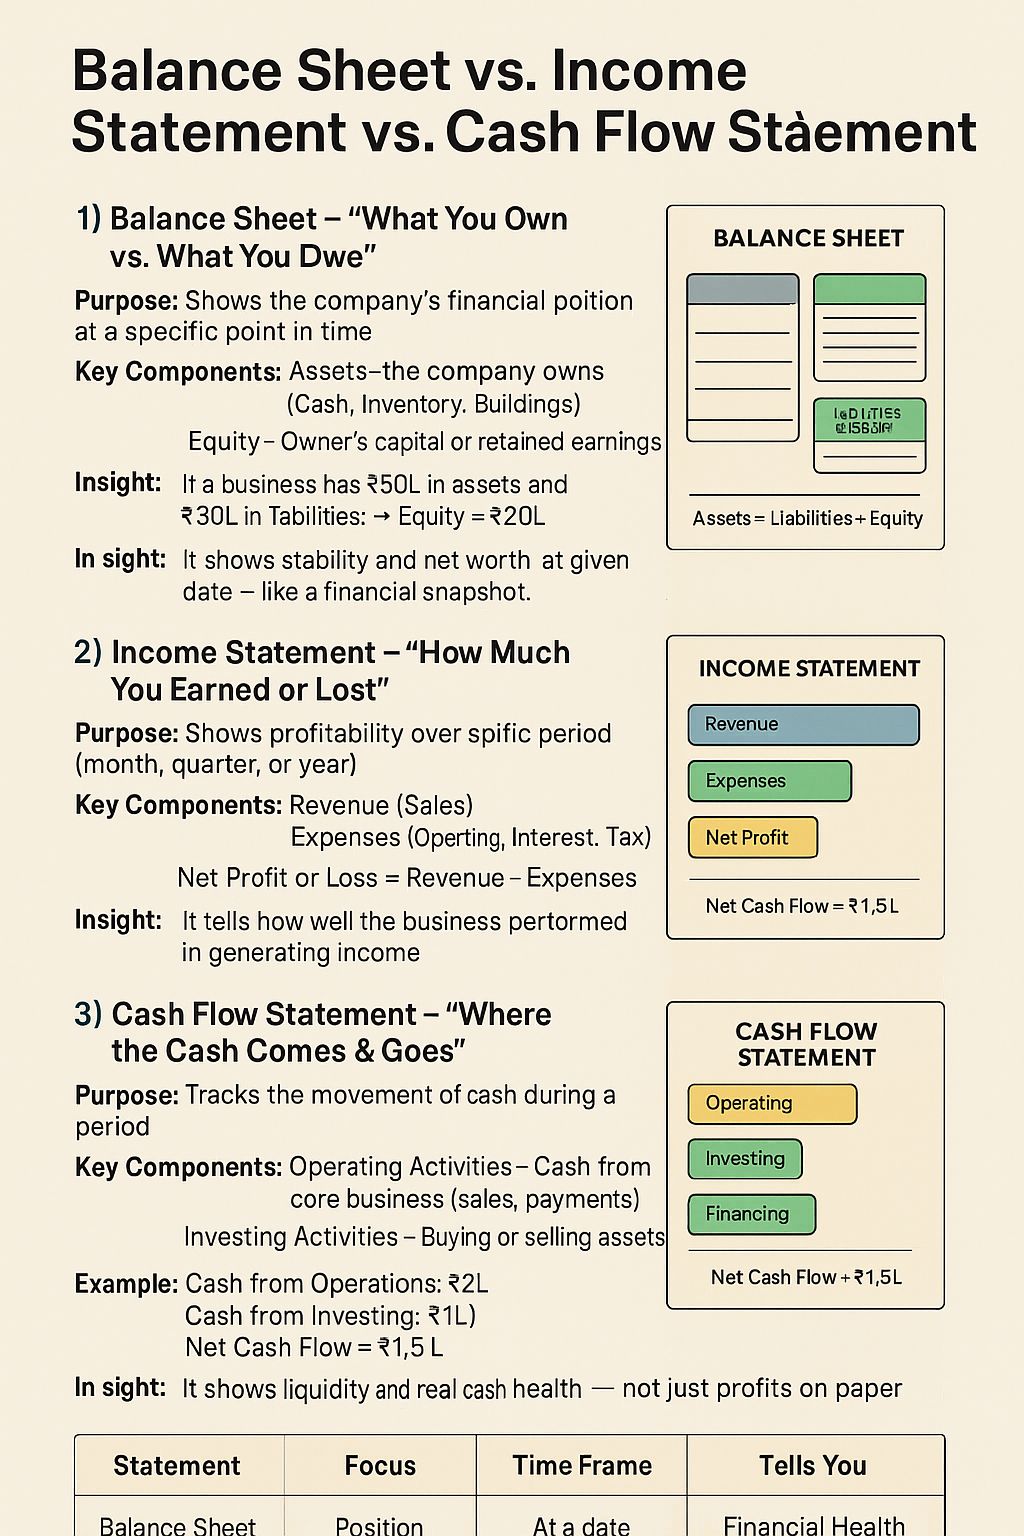
Balance Sheet – “What You Own vs What You Owe”
- Purpose: Snapshot of financial position at a specific date. Key Components:
- Assets: Cash, inventory, property.
- Liabilities: Loans, payables.
- Equity: Owner’s capital, retained earnings.
- Formula: Assets=Liabilities+Equity\{Assets} = \{Liabilities} + \{Equity}
- Example: Assets INR 50L – Liabilities INR 30L → Equity ₹20L
- Insight: Shows net worth and financial stability.
Components of a Balance Sheet
Step 1: Understand the Structure
A balance sheet follows this fundamental equation: Assets = Liabilities + Shareholders’ Equity
- Assets: What the company owns (cash, receivables, inventory, plant, property, etc.)
- Liabilities: What it owes (loans, creditors, provisions, etc.)
- Equity: Owners’ capital and retained earnings
Step 2: Analyze Assets
Current Assets
- Include cash, accounts receivable, inventory, short-term investments.
- Indicate liquidity and the firm’s ability to meet short-term obligations.
- Key Ratios:
- Current Ratio = Current Assets / Current Liabilities
- Quick Ratio = (Current Assets – Inventory) / Current Liabilities
Non-Current (Fixed) Assets
- Include plant, machinery, property, and long-term investments.
- Check for:
- Overstated book values vs market value
- Depreciation adequacy
- Asset turnover ratio = Sales / Average Total Assets
Assets – What the company owns
- Current Assets: Used within 1 year.
- Long-Term Assets: Last longer than 1 year.
- Liquidity Order:
- Cash & Cash Equivalents
- Marketable Securities
- Financial Assets
- Accounts Receivable
- Inventory
- Property, Plant & Equipment
- Intangible Assets
- Goodwill
Step 3: Analyze Liabilities
Liabilities – What the company owes
- Current Liabilities: Due within 1 year.
- Long-Term Liabilities: Due after 1 year.
Current Liabilities
- Obligations due within a year: creditors, short-term loans, outstanding expenses.
- Assess whether the company has enough liquidity to pay them off.
Non-Current Liabilities
- Long-term borrowings and deferred liabilities.
- Check the Debt-to-Equity Ratio to measure leverage.
Debt-Equity Ratio = Total Debt / Shareholders’ Equity
- A high ratio : high financial risk
- A moderate ratio: efficient leverage
Step 4: Evaluate Shareholders’ Equity
- Comprises share capital, reserves, and retained earnings.
- Indicates how much of the company is funded by owners versus lenders.
- Rising reserves and stable retained earnings signal good profitability.
Return on Equity (ROE) = Net Profit / Shareholders’ Equity
Shareholders’ Equity : Represents net worth.
Formula: Equity=Assets−Liabilities\{Equity} = \{Assets} – \{Liabilities}Includes retained earnings, preferred stock, treasury stock.
Step 5: Check Liquidity and Solvency
- Liquidity: Ability to meet short-term obligations (use current & quick ratios).
- Solvency: Long-term financial stability (use debt ratios).
Step 6: Trend Analysis (Year-over-Year)
Compare the balance sheet over several years to spot trends:
- Is debt increasing faster than assets?
- Are current assets growing in line with sales?
- Are reserves strengthening over time?
Step 7: Common Red Flags
- Rapid increase in receivables or inventory : weak collection or overstocking.
- Shrinking cash reserves despite rising sales : cash flow mismatch.
- High short-term borrowings : liquidity pressure.
- Declining net worth : accumulated losses or poor profitability.
Step 8: Supplement with Ratio Analysis
To get deeper insights, link balance sheet data with income statement and cash flow ratios:
- Current Ratio : Liquidity strength
- Debt-Equity Ratio : Leverage
- ROE / ROA : Profitability
- Asset Turnover : Efficiency
Income Statement : “How Much You Earned or Lost”
- Purpose: Measures profitability over a period. Key Components:
- Revenue: Sales income.
- Expenses: Operating, interest, tax.
- Net Profit:
Revenue−Expenses\{Revenue} – \{Expenses}
- Example: Revenue INR 10L – Expenses INR 7L → Profit INR 3L
- Insight: Reflects business performance and efficiency.
Cash Flow Statement – “Where the Cash Comes & Goes”
- Purpose: Tracks actual cash movement. Key Components:
- Operating Activities: Sales, payments.
- Investing Activities: Asset purchases/sales.
- Financing Activities: Loans, equity, dividends.
- Example: Operations ₹2L – Investing INR 1L + Financing INR 0.5L → Net Cash INR 1.5L
- Insight: Reveals liquidity and cash health.
How They’re Connected
- Net Profit from the Income Statement : Retained Earnings in Balance Sheet. Net Profit from the Income Statement flows into the Equity section of the Balance Sheet as retained earnings.
- Cash Flow Statement starts with Net Profit: adjusts for non-cash items & working capital. The Cash Flow Statement starts with Net Profit and adjusts for non-cash items and working capital changes.
- Together, they provide a complete financial picture.Together, these statements provide a 360° view of financial health.
- A company may show profit on paper, but if cash is tied up in receivables, the Cash Flow Statement will reveal shortages — highlighting why all three reports are essential. Help investors assess company performance, Enable banks and NBFCs to evaluate creditworthiness, Support management in decision-making and financial planning, Ensure transparency for regulatory and audit compliance
-
-
Balance Sheet = Stability
-
Income Statement = Profitability
-
Cash Flow = Liquidity.
-
Quick Example Summary
A company shows profit in the Income Statement, but if cash is stuck in receivables,
➡ Cash Flow shows shortage
➡ Balance Sheet shows growing assets but low liquidity.
| Statement | Focus | Tells You About |
|---|---|---|
| Balance Sheet | Stability | Assets, liabilities, equity |
| Income Statement | Profitability | Earnings vs expenses |
| Cash Flow | Liquidity | Real cash movement |
How to Analyze a Balance Sheet – Key Questions
- How much cash is available?
- Are there accounts receivable?
- Is there goodwill? How much?
- What are the biggest liabilities?
- Does the company have debt? What kind?
- Is there any preferred stock?
- Are retained earnings positive?
- Is there any treasury stock?
Yellow Flags to Watch For : (typically include high debt, negative equity, excessive goodwill, etc.)
Key Takeaways
- The balance sheet tells you what the company owns and owes.
- Combine it with P&L and Cash Flow Statement for a 360° view.
- Focus on liquidity, leverage, and growth trends — not just totals.
- Always compare across years and against industry benchmarks.
**********************************************************
If this article has helped you in any way, i would appreciate if you could share/like it or leave a comment. Thank you for visiting my blog.
Legal Disclaimer:
The information / articles & any relies to the comments on this blog are provided purely for informational and educational purposes only & are purely based on my understanding / knowledge. They do noy constitute legal advice or legal opinions. The information / articles and any replies to the comments are intended but not promised or guaranteed to be current, complete, or up-to-date and should in no way be taken as a legal advice or an indication of future results. Therefore, i can not take any responsibility for the results or consequences of any attempt to use or adopt any of the information presented on this blog. You are advised not to act or rely on any information / articles contained without first seeking the advice of a practicing professional.